
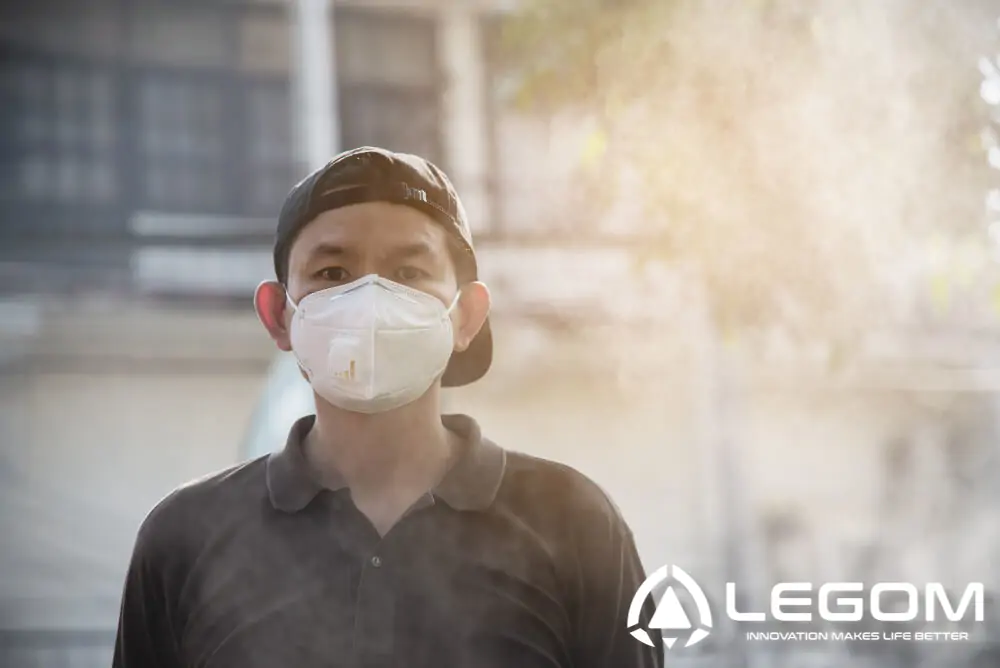
Looking up PM2.5 levels in major cities is easy. Understanding what you are looking at is harder, and it is where most people go wrong.
Open two different air quality apps for the same city at the same moment and you will often see two different numbers. Neither is broken. They may be reporting on different scales, averaging over different periods, or drawing from monitoring stations kilometres apart. Without knowing which, a reading is just a number.
So this page does something more durable than list today’s figures, which change hourly and are better taken from a live source. It explains what the numbers mean, what the WHO guidelines actually are, why some cities sit ten or twenty times above them while others do not, and how to compare two readings without misleading yourself. Live data sources are linked at the end.
The Reference Point: WHO Guidelines
Every comparison needs a baseline, and the World Health Organization’s 2021 Global Air Quality Guidelines provide it. For fine particulate:
- Annual mean: 5 µg/m³
- 24-hour mean: 15 µg/m³, not to be exceeded more than three or four days a year
Those numbers are strict, and deliberately so. They were lowered from the previous 10 µg/m³ annual guideline because the evidence showed health effects continuing below the old threshold. There is no concentration of PM2.5 at which harm reliably stops.
Keep the annual figure of 5 in mind, because it reframes everything that follows. A city averaging 25 µg/m³ sounds moderate until you note it is five times the guideline. The most polluted cities in the world run annual averages above 80 µg/m³, which is more than sixteen times over.
It is also worth knowing that national standards are generally much looser than the WHO guideline. A city can be fully compliant with its own air quality law and still sit several times above what the WHO considers safe. “Meets the standard” and “is safe” are not the same statement.
Why Readings Differ Between Apps for the Same City
This is the question that trips up almost everyone, and there are three separate reasons.
1. Different Index, Not Different Air
A reading of “150” means nothing until you know which scale it is on.
Many apps report the US EPA AQI, a 0 to 500 index converted from pollutant concentrations. But several countries publish their own index with different band boundaries. Singapore reports a PSI, Malaysia an API, and India and China each run national indices of their own. These are not interchangeable: Singapore’s PSI treats 101 to 200 as a single “Unhealthy” band where the US AQI splits that range into two separate categories.
So an app showing a US AQI of 160 for Singapore and the national agency showing a PSI of 140 can both be correct. They are different conversions of the same air. Our explainer on the air quality index, its numbers and colours sets out the band structures side by side.
The way around this is to compare in µg/m³, the raw concentration, rather than in index points. Micrograms per cubic metre means the same thing everywhere.
2. Different Averaging Period
A 1-hour reading and a 24-hour average for the same place on the same day can differ enormously.
The 1-hour figure is a snapshot. It spikes during rush hour, during a cooking period in a dense neighbourhood, or when a smoke plume arrives, and it falls again just as fast. The 24-hour average smooths all of that, which makes it the right basis for health advisories and the wrong basis for deciding whether to go outside in the next twenty minutes.
If two sources disagree sharply, check whether one is hourly and the other daily. Usually that is the entire explanation.
3. Different Monitoring Station
Air quality varies substantially within a single city. A station beside a major road reads differently from one in a park two kilometres away, and on a day with light wind the difference can be a factor of two or more.
Many apps interpolate between stations or blend in satellite and model data to produce a city-wide figure, while a government portal typically reports each station separately. Neither approach is wrong, but they answer different questions. Before trusting a number, check how far the nearest station is from where you actually are.
How Cities Compare: the Structural Picture
Current readings belong on a live dashboard, not in an article, because they change hourly. What does not change much is the structural tier a city sits in, and that is more useful for orientation.
The bands below are indicative annual averages, given as a guide to scale rather than as readings for any particular city on any particular day. Daily figures swing far wider in both directions.
| Tier | Indicative annual PM2.5 | Versus WHO guideline of 5 | Where this pattern occurs | Dominant driver |
|---|---|---|---|---|
| Severe | Above 70 µg/m³ | 14 times and above | Northern South Asia, including Delhi and Lahore | Emissions plus winter inversion plus regional crop burning |
| High | 35 to 70 µg/m³ | 7 to 14 times | Parts of South and Central Asia, some Middle Eastern and African cities | Traffic, household solid fuel, industry, mineral dust |
| Elevated | 15 to 35 µg/m³ | 3 to 7 times | Much of East and Southeast Asia, parts of Eastern Europe and Latin America | Industry, vehicle fleet, seasonal burning episodes |
| Moderate | 8 to 15 µg/m³ | Roughly 2 to 3 times | Most of Western Europe, urban North America, developed East Asia | Traffic and residential heating |
| Low | 5 to 8 µg/m³ | At or near the guideline | Nordic countries, parts of Oceania, Canada outside fire season | Low emission density and good natural ventilation |
The uncomfortable conclusion from that table is at the bottom rather than the top. Almost no major city in the world sits at or below the WHO annual guideline of 5 µg/m³. Even the cleanest tier mostly exceeds it. The question for most people is not whether their air is above the guideline but by what multiple.
Two further points the tiers conceal:
Composition matters as well as mass. A reading of 50 µg/m³ driven by mineral dust in a Gulf city and a reading of 50 driven by diesel and coal combustion in an industrial city are not equivalent in health terms. The evidence is strongest for combustion-derived particulate, which carries organic compounds and metals alongside the carbon core.
Chronic and episodic are different problems. A city with a high annual average has a baseline exposure problem that filtration should address permanently. A city with a moderate average and severe seasonal haze has an episodic problem that calls for stock, planning and advisories. Southeast Asia is firmly in the second category; northern South Asia is in the first.
Why Some Cities Are So Much Worse Than Others
The gap between the world’s cleanest and dirtiest urban air is not mainly about how much pollution is emitted. It is about emissions, geography and weather acting together, and the same quantity of emissions produces wildly different concentrations depending on the other two.
Temperature Inversion: the Mechanism Behind Winter Peaks
Normally air cools with altitude, so warm surface air rises and carries pollutants up and away. During a temperature inversion, a layer of warmer air sits above colder surface air and that vertical mixing stops. The boundary layer, the slice of atmosphere pollutants can disperse into, collapses from a kilometre or more down to a few hundred metres.
The emissions have not increased. The volume they are diluted into has shrunk, so the concentration climbs. Add weak winds and high humidity, which help particles grow and persist, and a city’s readings can multiply within a day without anything changing on the ground.
This is why northern India and Pakistan see such severe winter episodes. It is also why the same cities can be comparatively unremarkable in summer.
Geography That Traps Air
Cities in basins and valleys, or ringed by mountains, have restricted horizontal ventilation. Pollutants that would blow out of a coastal plain city circulate instead. Combine a valley with a winter inversion and you have the worst possible configuration.
The Fuel and Combustion Mix
What a city burns matters more than how many people live in it:
- Solid fuel for cooking and heating. Wood, charcoal, coal and crop residue burned in households without flues produce very high particulate per unit of energy, and the emissions are released at ground level where people breathe.
- Agricultural burning. Post-harvest stubble burning around a city adds a seasonal regional load no urban policy can control.
- Forest and peat fires. Smoke travels hundreds of kilometres, which is how haze from Sumatra and Kalimantan reaches Singapore and Malaysia. Peat in particular smoulders rather than flames, producing a high ratio of fine particulate.
- Vehicle fleet age and fuel standard. An old diesel fleet on high-sulphur fuel emits a multiple of what a modern fleet on low-sulphur fuel does. Congestion compounds it, because idling engines emit while moving nobody.
- Industry and power generation. Particularly coal, and particularly where flue gas treatment is absent or unenforced.
- Dust. In arid regions, construction and wind-blown desert dust contribute a large baseline that has nothing to do with combustion at all. This is a significant part of the picture in the Gulf.
Secondary Formation
A substantial share of urban PM2.5 is not emitted as particles. Sulphur dioxide, nitrogen oxides and ammonia react in the atmosphere to form sulphates and nitrates, which then condense into fine particulate. That is why controlling gaseous emissions reduces particulate counts, and why a city can have rising PM2.5 without any obvious new source of smoke.
Health Effects at These Concentrations
Short term, within hours, elevated PM2.5 irritates the airways, triggers asthma attacks, and produces coughing, chest tightness and shortness of breath. Hospital admissions for respiratory and cardiac conditions rise measurably within a day or two of a pollution spike.
Long term, sustained exposure is associated with chronic obstructive pulmonary disease, ischaemic heart disease, stroke, lung cancer and reduced life expectancy. Particles in the finest fraction cross from the lung into the bloodstream, which is how an air pollutant becomes a cardiovascular risk factor.
In children the concern is developmental. Continued exposure during the years when lung tissue is still forming is linked to lower peak lung function in adulthood, and that deficit does not recover later.
The groups most affected are children, older adults, pregnant women, and anyone with existing respiratory or cardiac disease. There is also a consistent equity dimension: lower-income populations in most cities live closer to major roads and industrial sources, so exposure is not distributed evenly across a city’s residents.
Our page on PM2.5 health effects covers the mechanisms in detail, and indoor asthma triggers covers the respiratory side.
What Cities Can Do, and What Works
Briefly, because the evidence is reasonably clear on which measures move the number:
Fuel quality and vehicle emission standards. The single largest driver of the improvement seen in Europe, North America and more recently China. Low-sulphur fuel plus particulate filters on diesel engines removes a large fraction of urban combustion particulate.
Replacing household solid fuel. Where households burn wood, charcoal or crop residue indoors, providing access to cleaner cooking fuel reduces both outdoor concentrations and the far higher indoor exposures those households experience.
Flue gas treatment on industry and power generation. Reduces both primary particulate and the sulphur dioxide and nitrogen oxides that form secondary particulate.
Addressing agricultural burning. Needs regional rather than municipal action, and realistic alternatives for farmers, since enforcement alone has a poor record.
Monitoring and public reporting. Not a control measure, but a precondition for one. Cities cannot manage what they do not measure, and public reporting changes behaviour.
On urban greening, a note of realism. Trees provide genuine benefits including shade, cooling and amenity, and leaf surfaces do intercept some particulate. But the particulate removal effect is modest relative to the emissions, and in narrow street canyons dense planting can actually impede ventilation and raise kerbside concentrations. Green space is worth doing for several good reasons; treating it as a primary air quality control is not supported.
What You Can Control: Indoor Air
City-scale policy operates on a timescale of years. Your own exposure can change this week, and since most people spend the large majority of their time indoors, indoor air is where individual action has the most leverage.
When outdoor PM2.5 is high, keep windows closed, switch mechanical ventilation to recirculate, and run filtration. Indoor concentrations track outdoor ones within hours in an unfiltered building.
Filter with HEPA. A HEPA filter removes the fine particulate that drives the readings. Class H13 to EN 1822 captures at least 99.95% at the most penetrating particle size. Size the unit to the room volume, because an undersized purifier cannot turn the air over fast enough to keep up.
Add activated carbon where smoke is involved. HEPA media captures particles and does nothing to gases. Smoke from fires carries carbon monoxide, sulphur dioxide, nitrogen oxides and volatile organic compounds that pass straight through, which is why a room can show a clean PM2.5 reading and still smell of smoke. Our comparison of HEPA and activated carbon filters explains both mechanisms.
Do not forget indoor sources. Cooking is a major PM2.5 source in its own right and can push kitchen concentrations above outdoor levels on a bad day. See reducing PM2.5 from cooking and removing formaldehyde from indoor air.
Ventilate as well as filter. A sealed room accumulates carbon dioxide from its occupants and no filter removes it. That is what causes the drowsiness often blamed on a purifier, and it is why fresh air units with filtration exist alongside recirculating purifiers.
Where to Get Live PM2.5 Data
For current readings rather than a structural picture:
- Your national environmental agency, which is the authoritative source for your own country and the basis for official health advisories.
- IQAir and AQICN, which aggregate station data globally and report city-level figures.
- A local monitor reporting µg/m³ directly, which is the only way to know what you are breathing rather than what a station across town is recording. Pair it with a CO2 reading indoors and you can see whether your filtration and your ventilation are both working.
Whichever you use, check the three things from earlier: which index, what averaging period, and how far away the station is.
Legom Air Purification
Legom manufactures air purification and ventilation equipment in Jiaxing, Zhejiang, supplying more than 90 countries.
Our air purifier range covers household units such as the KJ200F-A01, wall-mounted fresh air units such as the XFQT-60-01S, which filters incoming outdoor air rather than only recirculating, and high-volume commercial ventilators such as the XFDD3-650-01J for schools and offices.
In cities in the severe and high tiers above, filtration is not seasonal equipment. The exposure is a baseline rather than an event, and institutional buyers increasingly specify filtration as policy for that reason. Distributors and retailers sourcing for those markets will find the commercial side covered in our guide to HEPA air purifier wholesale sourcing.
Frequently Asked Questions
What is a safe PM2.5 level?
The WHO 2021 guidelines set 5 µg/m³ as an annual mean and 15 µg/m³ as a 24-hour mean. There is no concentration at which harm reliably stops, so those are guidelines for acceptable risk rather than a safety threshold. National standards are generally looser, so a city can comply with its own law and still sit well above the WHO figure.
Why do two apps show different PM2.5 or AQI numbers for my city?
Three usual reasons. They may use different indices, since the US AQI, Singapore’s PSI, Malaysia’s API and various national indices have different band boundaries. They may use different averaging periods, as a 1-hour and a 24-hour figure differ widely. Or they may draw on different monitoring stations, which can vary by a factor of two across one city.
Which cities have the worst PM2.5 levels?
Northern South Asia carries the highest sustained urban levels, with cities such as Delhi and Lahore running annual averages well above 70 µg/m³, more than fourteen times the WHO guideline. Parts of South and Central Asia, the Middle East and Africa follow. For current rankings use a live source, since positions shift between seasons and years.
Why is air pollution worse in winter in Delhi and Lahore?
Temperature inversion. A warm layer above cold surface air stops vertical mixing, so the volume pollutants can disperse into collapses from a kilometre or more to a few hundred metres. The emissions have not increased; the dilution has. Weak winds, high humidity and regional agricultural burning compound it.
Is a high PM2.5 reading from dust as harmful as one from smoke?
Not identically. The health evidence is strongest for combustion-derived particulate, which carries organic compounds and metals alongside the carbon core. Mineral dust at the same mass concentration is generally considered less harmful per microgram, though it is far from benign. This matters when comparing Gulf cities against South Asian ones at similar numbers.
Should I compare cities using AQI or µg/m³?
µg/m³. Micrograms per cubic metre means the same thing everywhere, while index points depend on which country’s conversion is being applied. Comparing a US AQI figure against a PSI or a national AQI figure is comparing two different scales.
Do air purifiers help in a heavily polluted city?
Yes, for the particulate, which is what drives the readings. A HEPA unit sized to the room removes PM2.5 effectively, provided windows are closed and mechanical ventilation is recirculating. Where smoke is involved you also need activated carbon, because HEPA does nothing to gases. And a sealed room still needs ventilation, since no filter removes carbon dioxide.
Do trees and urban parks reduce PM2.5?
Modestly. Leaf surfaces intercept some particulate and green space delivers real cooling and amenity benefits. But the removal effect is small relative to emissions, and in narrow street canyons dense planting can impede ventilation and raise kerbside concentrations. It is worth doing, but not as a primary air quality measure.
Reviewed by Maggie Shen, Director at Legom, on October 15, 2026. This article was reviewed for technical accuracy, including the WHO 2021 guideline values of 5 µg/m³ annual and 15 µg/m³ 24-hour, the three distinct reasons air quality readings differ between sources, the temperature inversion mechanism behind winter pollution episodes, the role of secondary particulate formation, the difference between dust-derived and combustion-derived particulate, and the limited air quality effect of urban greening.